Reporting
capabilities of MS Project’s standalone desktop editions/versions have been
greatly improved by the introduction of the graphical reports, starting from MS
Project Standard/Professional 2013. The text reports feature supported by the
earlier versions was discontinued by the introduction of this new reporting
tool. Thus, MS Project 2010 is the last version of the product that includes the
text reports.
In this
eBook, you will find all the information that you need in
order to develop tabular reports in all
versions and also
to create views,
visual reports and graphical reports that present the project information in tabular format
in later versions so as to deliver the
same or similar content as the text reports.
This eBook will
also show you
how to
produce new project data in MS Excel, by performing calculations on the data
exported from MS Project by using either the Visual Reports or the field mapping
feature.
Text Reports
vs. Graphical Reports -- In text reports,
you can filter, sort and group the values in the
table fields in order to interpret the project data so
as to understand the project status and to see the
variances from the planned values. While these text
reports may show you the current status of the project
and then they may help you with revising the project
plan to take corrective actions accordingly, you need
some graphs and charts that show you how the actual
values in the timephased-table versions of these fields
change against the planned ones over time or how they
trend such that you can interpret how the project has
been progressing so far and somehow forecast how its progress
could be in future periods for taking preventive actions when
necessary. So, you need Graphical Reports that plot the timephased
data of these fields over the time periods in order to
see the trend and also to visually compare them with
each other. These graphs may also help you to identify
where to focus on the table data that the text report
contain.
|
Professionals, who currently run MS Project
2010, and therefore, who want to gain a good
understanding of this feature, and at the
same time, who are currently considering or
already planning/undergoing a transition to
a later version of the product supporting
the graphical reports feature
may benefit from the content presented in
the eBook.
Although the later versions of the product
no longer support the text reports feature,
tabular reporting, that is, processing
and then presenting project data in flat or
crosstab tables, is an important part of
project reporting, and therefore, users of
all stand-alone desktop editions/versions
may find this eBook useful as a reference on
reporting the project data in tabular
format by
making use of the features that MS Project
offers.
This eBook assumes that you are currently
using MS Project in planning and managing
projects and you are already familiar with
views, tables, filters, groups and sorting
as well as all the reporting features
available in the desktop edition/version of
the product used. It is also assumed that
you are familiar with handling MS Project
formulas and
working with the PivotTables in MS Excel.
Other Details on the eBook
The content of the eBook complies with the
standalone desktop editions/versions, MS
Project 2010 through 2019.
The eBook contains 358 pages,
including the cover
pages, and the contents and index sections.
There is no printed version of this eBook.
The mpp files for the eBook are not
available to purchase. A link to download a
text file containing the codes listed in the
eBook will be provided along with the eBook during the purchasing
process.
The Contents and Introduction sections of
the eBook are available
here to review.
Also
click the links below to see the
screenshots from some of the table/crosstab reports
developed in the eBook:
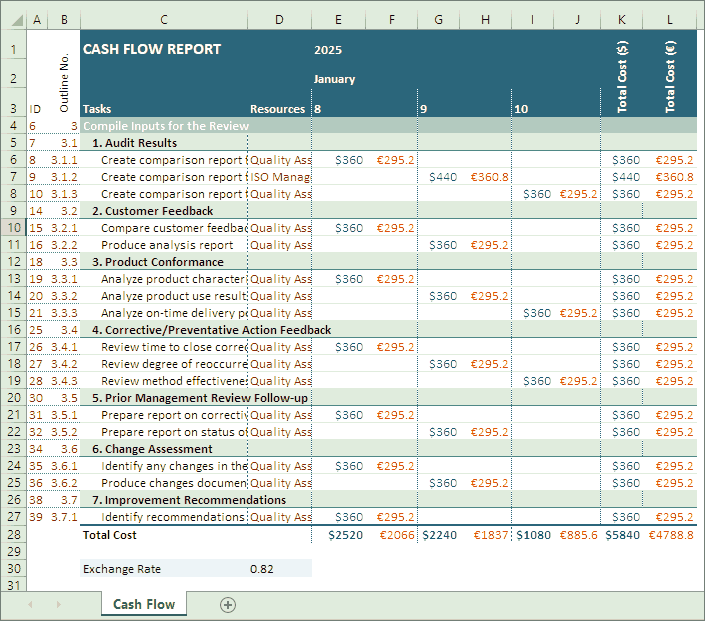
Cash Flow Report
(a date-range applied OLAP-based PivotTable (a reusable template) that shows the cost values in two
currencies)
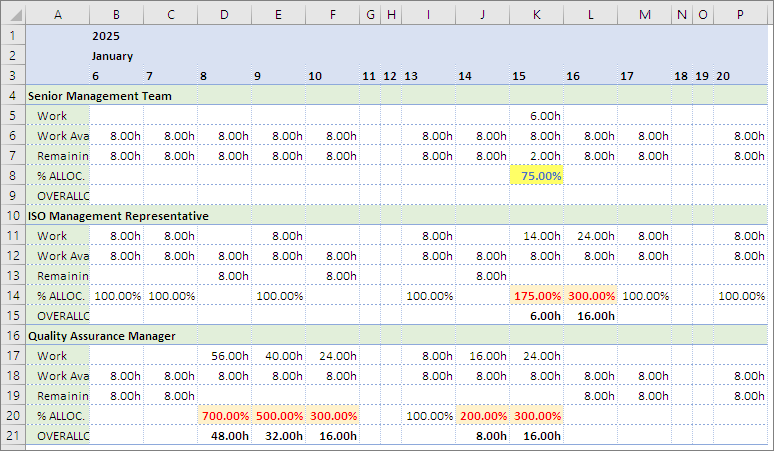
Percent Allocation and
Overallocation Report (a conditional-formatting applied OLAP-based PivotTable
(a reusable template) that
shows under- and over-allocations along with the number of hours
overallocated)
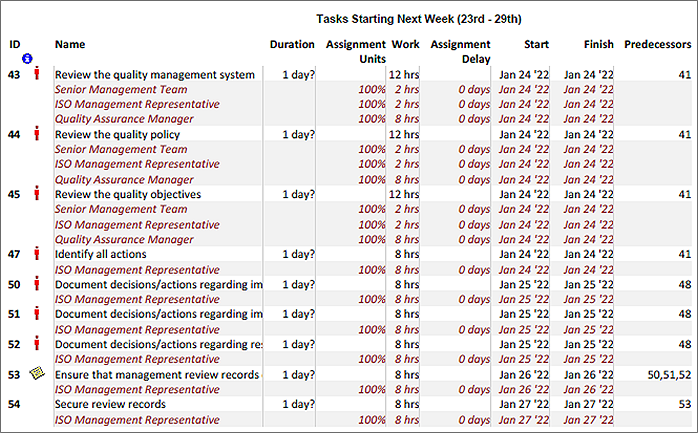
Task Starting Next
Week Report (a preview of the customized usage view)
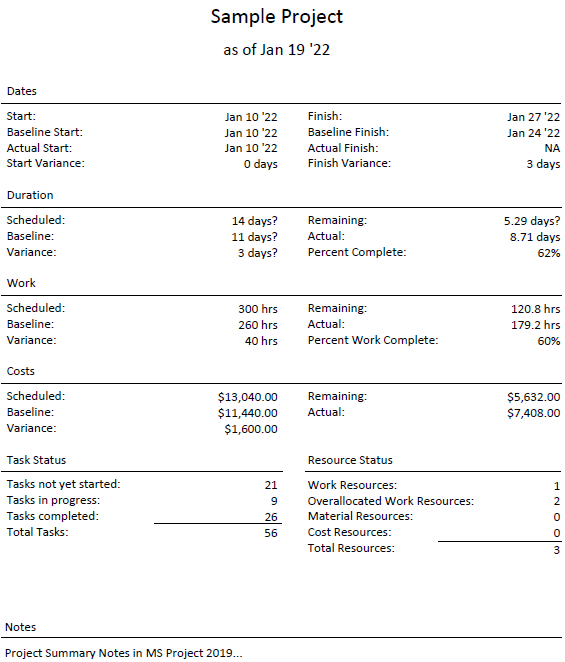
Project Summary Report
(a graphical report that shows the data calculated by the custom field
formulas)
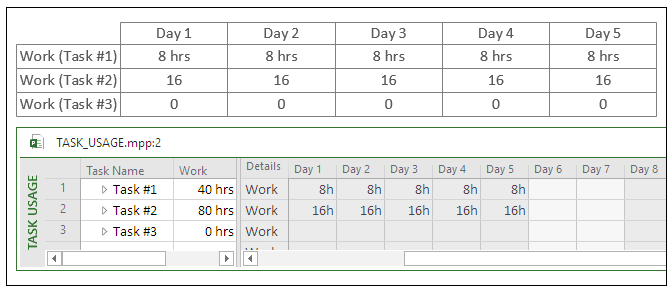
Graphical reports that show
task timephased
work data,
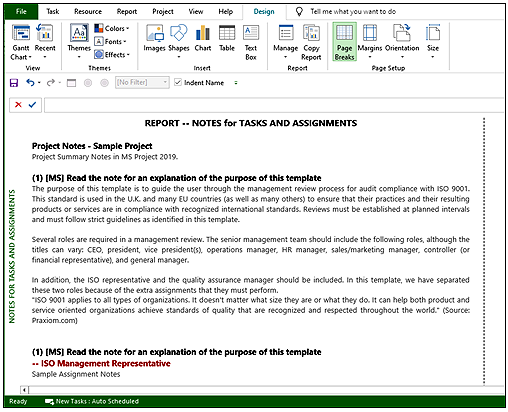
task and assignment notes (VBA subroutines)
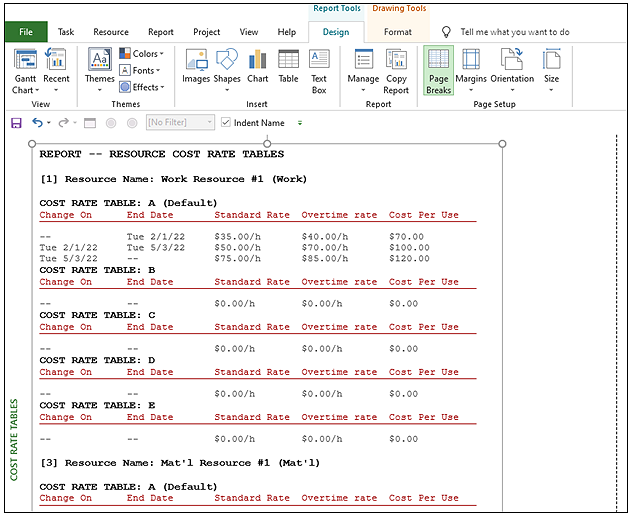
and cost rates (VBA subroutines)
Any topic on planning, scheduling and
managing projects with MS Project, any
conceptual topics on project reporting and
any project reporting implementations on specific areas
that require focusing on the techniques
and/or analyzing the report content rather than
MS Project's reporting features are outside
the scope of this eBook.
The details on the electronic book
format of the eBook are as follows:
-
Page size of the eBook is
8.5 x 11 inches (the paper size
Letter).
-
eBook is in pdf format and no other
electronic format of the eBook is available.
-
eBook can
be viewed by any pdf viewer.
BONUS Material - Free
Download
See the
details
here.
Note that it is not included as a supplement to
your purchase, but instead, presented as a bonus
to the pdf eBook. This is the
download link.
IMPORTANT NOTE - Users of this material
are expected to have basic skills to view and
run custom macros and adjust security settings
to enable the macros in MS Project desktop,
versions 2013 and later. MS Project 2007/2010
users do not need these macros since they can
utilize the Text Reports feature for viewing and
printing calendars. On the other hand, these
macros can be easily modified for outputting to
the Immediate Window or a text file. See the
version that outputs only to the Immediate
Window here.
|
How to
Buy the eBook
Important Note to Purchasers - All sales are final.
The purchase of this eBook is
not refundable and
no returns
are accepted for this eBook. Therefore,
review the sample content thoroughly on your
computer system and make sure that both the
content and the
format suit your needs before
attempting to buy the eBook.
Click the ordering button below if you want
to purchase the eBook (Price:
US$19.99). You will
receive an email with the download
link as soon as you complete
your purchase.

All transactions
will take place
through
FastSpring's
system (a BBB A+
accredited business
in US) and the eBook
file will be
delivered
directly from
FastSpring's
servers.
Note about SPAM
filters: You are
going to receive
important
information via
email. If you
haven't received an
email regarding your
order within 30
minutes, please
carefully check any
SPAM folders and
filters to see if
the message has been
blocked.
|